I am so delightful and excited to announce the latest release version of PSE trading journal spreadsheet (version 8.1) from AA Excel Spreadsheets! I had the chance to use and review the PSE Trading Journal Spreadsheet V7.3. It was very helpful because it helps me to review all of my trades. Not only that, it allowed me to revisit the bad and good strategies I did for my past trades. This is one of the few reasons why should a trader, whether a veteran or newbie, should have a document like this available. It will give you a high-level insight into how well are you performing with your trades. If you really are successfully gaining or little by little losing your capital. Now, let’s go back to the latest version of PSE trading journal spreadsheet (V8.1). But let us start by sharing this quote to our valued readers.
“Record where you bought and where you sold every single trade. Pretty soon you’ll have a track record of average losses and average wins, and the frequency of the wins and losses.”
– by Mark Minervini
Practically speaking it does make sense, right? If you want to gauge your strategies and success in PSE stock trading then you need to have some sort of document to backtrack. And having a trading journal should do the trick! To be fair, having a documentation does not only apply on PSE stock trading but on almost any trading markets.
So, let’s now try the latest PSE Trading Journal Spreadsheet (V8.1)! Let’s explore how effective the new version and how does it differ from it’s predecessor versions.
Page Contents
AA Excel Spreadsheets’ PSE Trading Journal Spreadsheet version 8.1
After I received and opened for the first time the latest release version of this trading journal from our good friend in AA Excel Spreadsheet, I was really amazed! Why? Just look at the new Dashboard tab below as compared to the 7.3 version I review I did before! By the way, if I am not mistaken the steps on how to use PSE Trading Journal Spreadsheet version 8.1 is not different from the last 7.3 version I have.
Trading Journal Spreadsheet v7.3 Dashboard
PSE Trading Journal Spreadsheet v8.0 Dashboard
There’s a noticeable big difference, right? Let us try to dig a little bit more about this new PSE Stock Trading Spreadsheet version 8.1 tool.
Introducing PSE Trading Journal Spreadsheet version 8.1
In this review, I will show you how to use this latest version of PSE trading journal spreadsheet differently. Instead of just discussing each worksheet’s functionality, let’s do it in such a way like you’re using it in a real-life trading situation. Although, using this tool is not limited and doesn’t have really a strict process – well, except for the Trade Log and Bank Transfers. These 2 are the heart and soul of your whole journal, the way I see it.
For the sake of testing/simulation, we will be using mocked and pre-populated data for this whole review. The objective is to show you all how effective and how the latest PSE Stock Trading spreadsheet works!
Let’s begin!
Bank Transfers – Document all your Deposits and Withdrawals
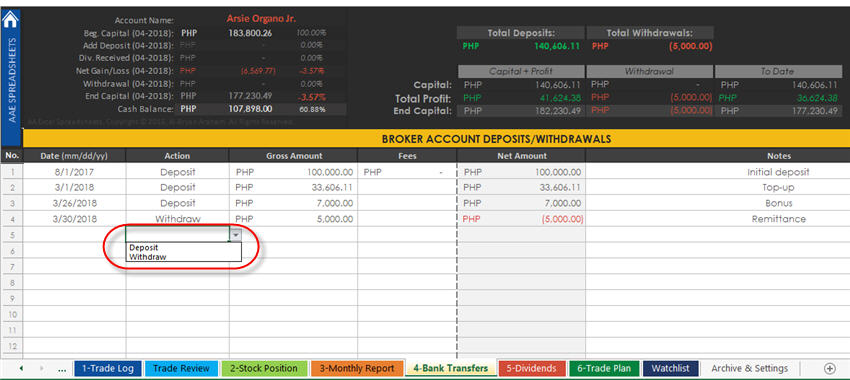
The very first thing that I’d do is document how much will I invest in the stock market. And as time goes by, I also need to input how much I’ve added or withdrew from my stock investment. It does not make any sense if you don’t input your investments or disinvestment in the stock market, right? How can you gauge your gains/losses if you will not fill-up this worksheet?
Inside this Bank Transfers worksheet, it is a must that you input ALL of your deposits and/or withdrawals. On top of this page, you will see a summary of your asset. Information such as your:
- Initial capital for the current month
- The amount you have deposited for the month
- Cash Dividend gains for the month
- Net (Gain/Loss) for the month
- The amount you have withdrawn for the month
- Ending capital for the month
- Current Cash Balance
- Total Deposits for your port
- Total Withdraws from your port
- Total Capital + Profits (from your trades)
- To-date cash/capital
ALL entries, small or big, should be documented here. As I’ve mentioned earlier, the information here is very vital for your journal!
Watchlist – Let’s do a little bit of window shopping
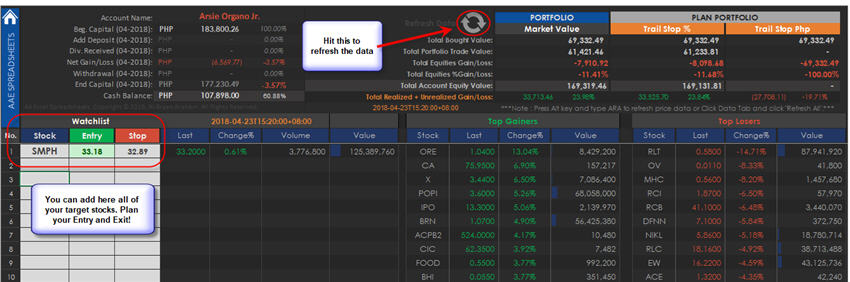
We always recommend to our friends/colleagues – “If there is no plan, then there should be no trade!“.
Imagine yourself as a student who has not done his homework or studied anything about the topic that will be discussed for tomorrow’s class. What do you think will happen? It’s either you will feel, you’ve missed a lot and everything is too blurry during the class discussion. OR, if you attempted to engage yourself in the discussion then there’s a big chance that you will FAIL! You’re lucky if you can survive!
This is the same high-level analogy that we wanted to describe before you enter a trade. The Watchlist worksheet can help you in planning your trade by adding your target stock/company under your radar. Then you have to set your Entry and Exit plans or price. And remember to be strict with your plans. The Entry and Stop alert columns are among the new features of PSE trading journal version 8.x.
We’ve seen a lot of traders losing a lot just because of emotions – that includes me! Try to study first and get a confluence when and why you should enter. For the sake of example, let’s say you are a swing trader or position trader and you are looking at $SMPH (SM Prime Holdings, Inc.). Since traders are more inclined in Technical analysis, you will need a tool that can give you the price actions and indicators that will help you. I recommend using either Investagrams Chart or Tsupetot’s PSE Chart Tool. The image below was done through Investagrams.
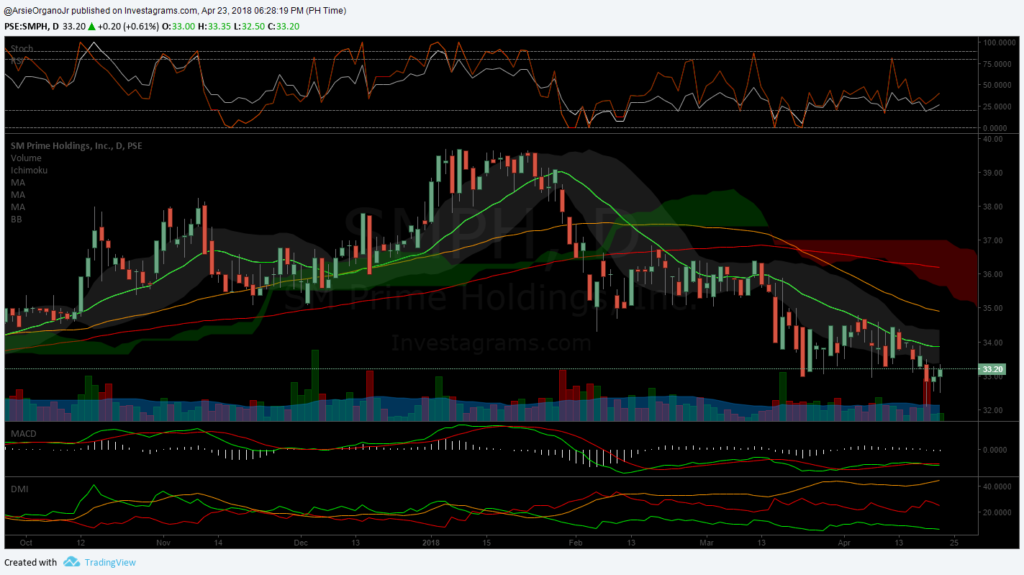
As you can see in the graph, although Stoch + RSI seems to be in the position to move upwards, and the Bollinger bands is getting more constricted. However, the trend is still bearish if you look into the price action movements and the price is below the MA20, MA50, MA100 respectively. Moreover, MACD and RSI are showing the same thing. BUT this is a good opportunity for long term investors/traders – even for swing and position traders. Especially that we have seen the confirmation candle from the closing price.
On the next trading day, I just need to make sure that I follow my entry and if my plan does not go my way – then I have to immediately execute my Exit!
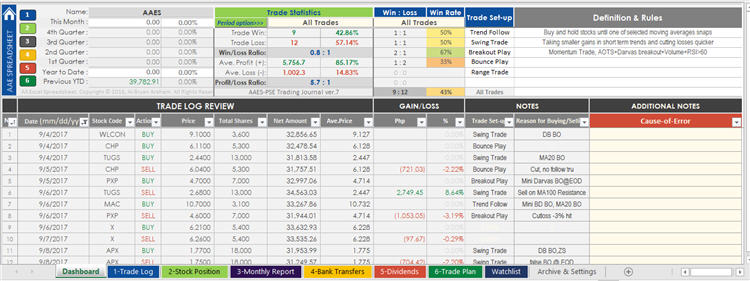
Trade Log – Let’s get into the market
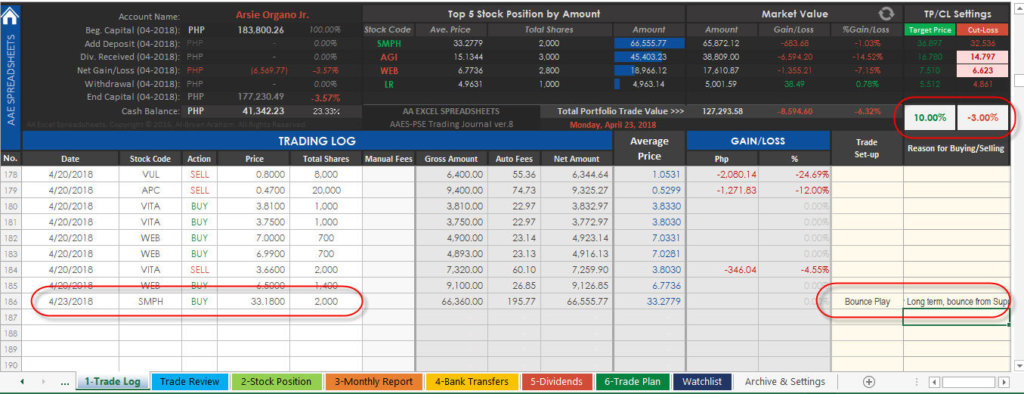
The very heart of PSE Trading Journal Spreadsheet tool – the Trade Log worksheet! This is the most important worksheet of all which I have already mentioned. Aesthetically speaking, the only changes I can see here is the refresh data button (right side of Market Value) and the color/theme of the summary report. The old functionalities of the previous version are still there. You can still set your Target price (TP), and Cut-loss (CL) in a percentage format. So to recap again, here’s the high-level steps on how to use the Trade Log worksheet:
- Input your buy/sell transactions under the Trading Log.
- The Fees are automatically computed based on the standard fees for most Trading platforms. But in case that there are fee corrections, like in IPO or Mutual fund trades then you can manually indicate the fees. Also, use to backup original fees in case of changes in fees or taxes.
- Record your decision making on each trades, add notes and trades setups.
- Automated cut loss and target price settings by %, Enter positive % value for target price or enter negative % value for the cutloss price.
Trade Review – So what made you execute your trade?
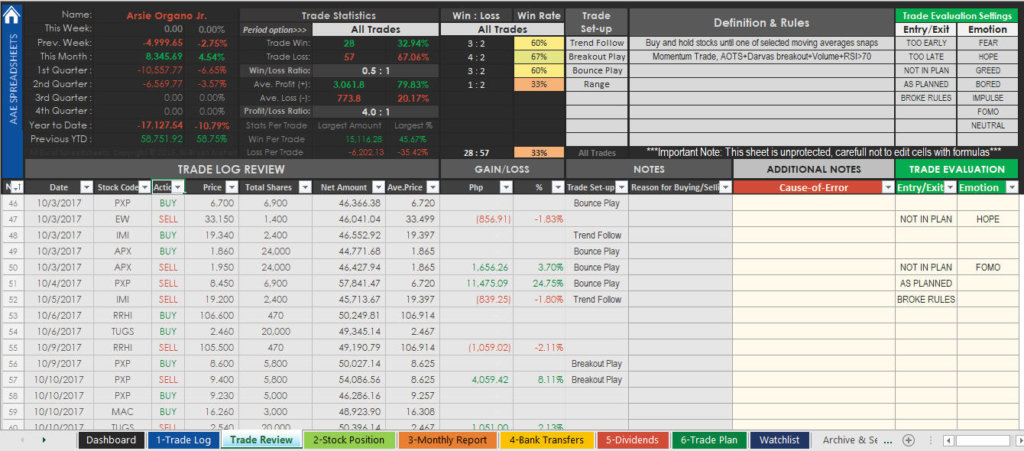
Sounds new to you? It may do sound something new feature if you’re used to having the old version (7.x) of PSE Trading Journal. But it is not really new if you take a closer look. Trade Review worksheet is what used to be known as the Dashboard of the old PSETJ version 7.x.
However, there is slight changes and here are they:
- Trade Evaluation Note Statistics (Entry/Exit and Emotion stats can be customized)
- Additional 2 rows entry for Trade Set-ups.
- Added This Week and Previous Week Performance
From here, you can review your past executions and strategies. You will be able to check what went right and what went wrong. It is also a good gauge of how emotionally you are when trading. The developer has prepared a few common examples of emotions that most traders experienced in the market. Based on my observation, two of them is very popular and common – GREED and FOMO (Fear of missing out)! As Nicolas Darvas once said:
“The CAUSE-of-ERROR tables helped me immeasurably. As I drew them up one after the other I was learning something from each trading.”
Use this sheet to reflect and make a better or improve your next trading strategy!
Trade Plan – Make use of Trail Stop!
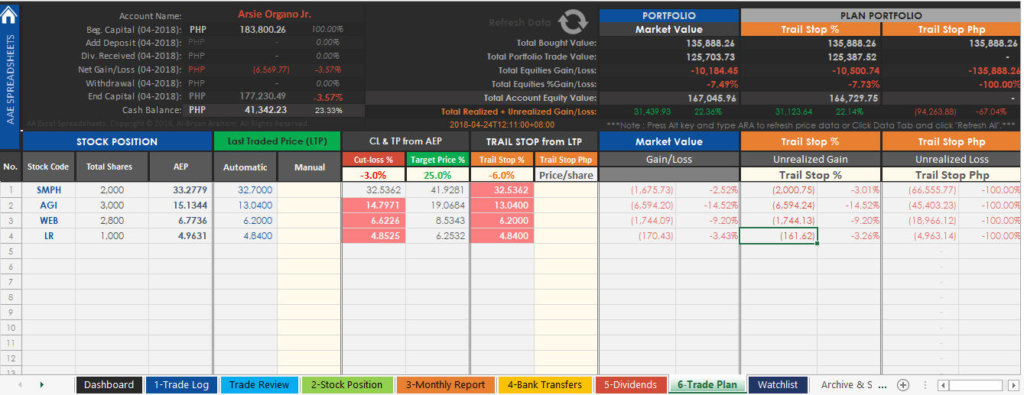
Since you have already executed your trade, Trade Plan worksheet will automatically populate your stock position on this page. By default, it will show you your calculated cut loss, target price, and trail stop values. The functionalities is the same as with the previous version wherein you can do the following:
- Manual Last Traded Price (LTP) option, in case the real-time market price doesn’t work. any value input will overwrite the auto price column.
- Cutloss, Target price and Trail stop calculation by %: Enter the desired percentage for each setting.
- Trail stop price: Enter exact trail stop price based on your technical analysis.
- Plan portfolio preview option: Select from options to preview your portfolio value once your plan has been executed.
Stock Position – What you have and had!
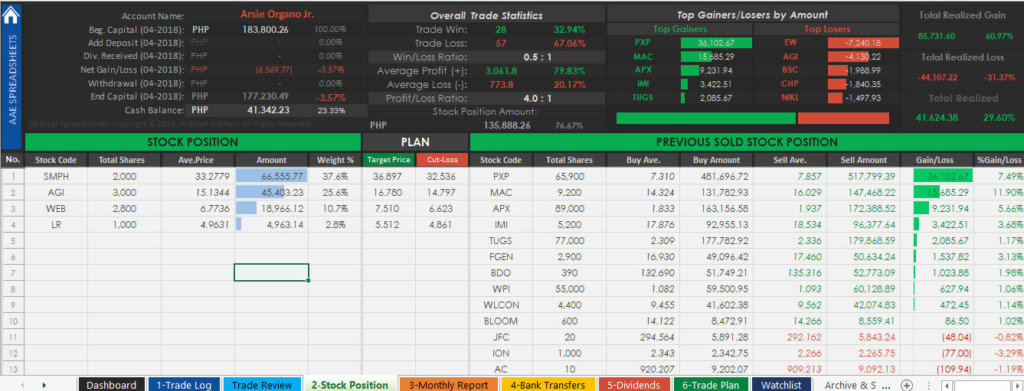
The Stock Position worksheet will simply show you what stocks you currently have and what you had previously. Also, it will show you a summary report above the following information:
- Overall Trade Statistics – A quick glance on the number of your winning and losing trades with the ratio. Also, the average profit and loss with the ratio.
- Top gainers and losers by the amount
- Total realized gains and loss
Dividends – Stock and Cash
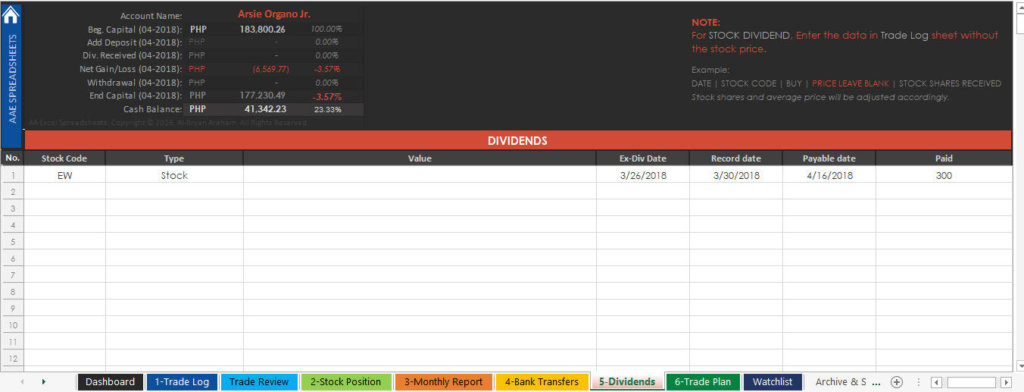
The Dividends worksheet, nothing special really on this part of the whole workbook aside from you documenting each dividend you accumulate – stock/cash. But do note the instructions for Stock Dividends. According to the developer:
For STOCK DIVIDEND, Enter the data in Trade Log sheet without the stock price.
Example:
| DATE | STOCK CODE | BUY | PRICE LEAVE BLANK | STOCK SHARES RECEIVED |
Stock shares and the average price will be adjusted accordingly.
Monthly Reports, Now in candlesticks chart!
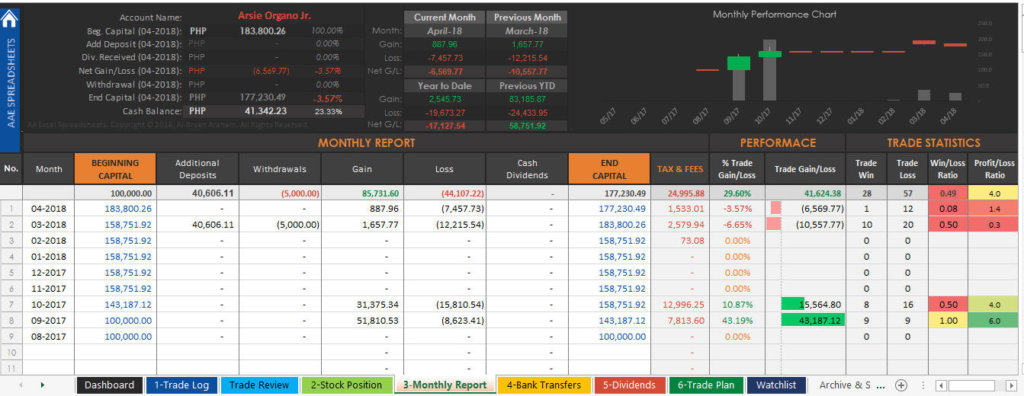
Yet another improvement in the interface of PSE Trading Journal Spreadsheet! And it now has a Monthly performance chart – in candlesticks form! It’s like the stock price action now!
So here’s the update from the developer.
- Monthly Performance Chart: From the line chart to candlestick chart, sorted months from newest to oldest
- Added trade statistics per month.
Note on Candlestick chart:
- Gap Up: Additional Deposit
- Gap Down: Withdrawal
- Volume: Sum of Buy and Sell Transactions Cost.
- Green Candle: Close the Period with Gain
- Red Candle: Close the Period with Loss
A really cool way to present reports while dealing with stocks!
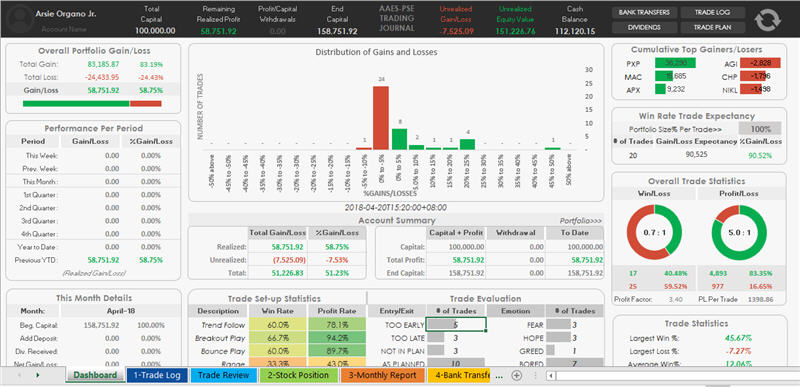
Dashboard – One look and it says it all
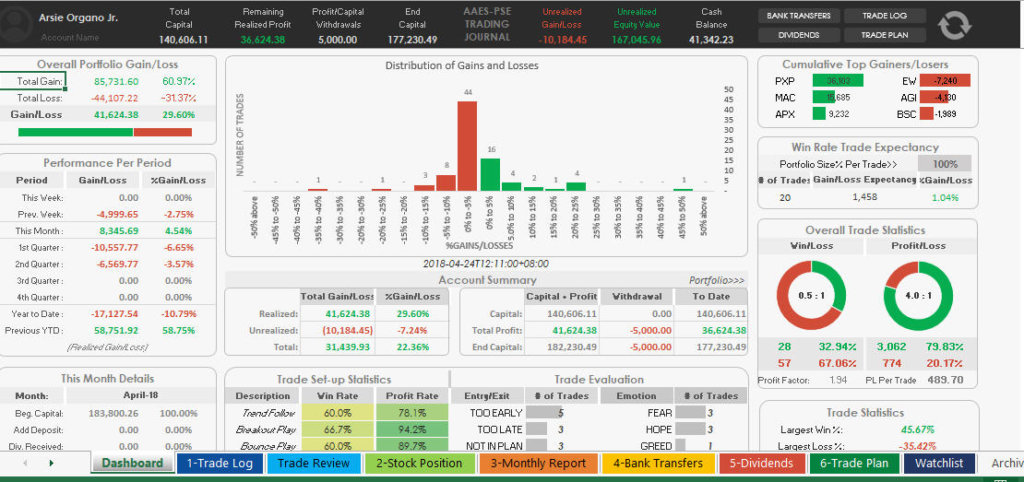
The new Dashboard worksheet contains different charts and important summary reports. As usual, it may look too overwhelming at first glance! It looks cluttered and there is too much information just looking on one worksheet. In summary, this is what the developer said about the new Dashboard:
- Distribution of Gains and Losses – From the book “Think and Trade Like A Champion” by Mark Minervini. The ideal distribution is to have as many outliers as possible on the right and the fewest on the left, attaining a “skewed” curve.
- Win Rate Trade Expectancy – A 20 trades expectancy based on win rate%, average win%, and average loss%.
- Overall Trade Statistics – Win/Loss and Profit/Loss Ratio on all trades and Gain/Loss expectancy per trade calculation.
- Performance Per Period – Automatically calculate your Weekly, Monthly, Quarterly, and Yearly Performance.
- Trade Statistics: Statistics per trade.
- Trade Set-up Statistics: Results of each trade set-up (Win Rate% and Profit rate%).
- Trade Evaluation: Results of notes statistics from “Trade Review” sheet.
But admittedly, just looking at the Dashboard worksheet gives me the whole picture of my trades! So, hat’s off to you AA Excel Spreadsheets!!!
Archive & Settings – Backup is always important!
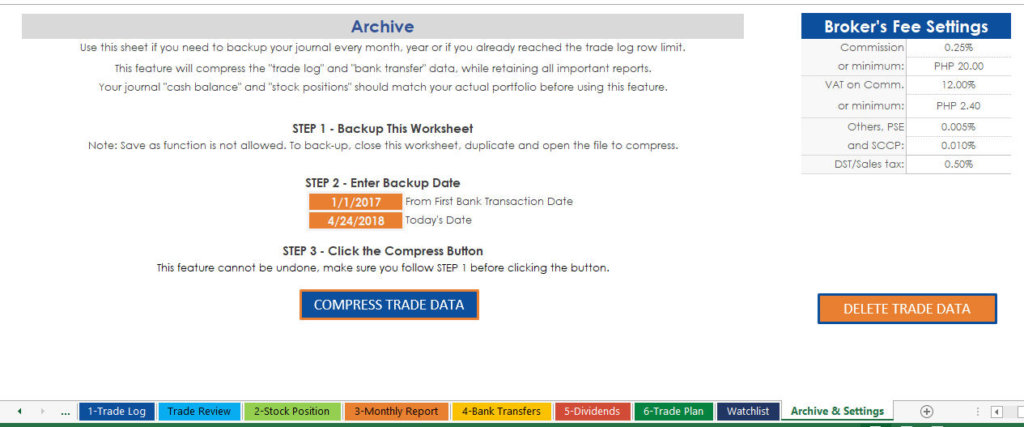
I am working in an I.T. industry for 18 years now as of writing this article and I think I’d be in the position to stress to my readers that backup is very important! This is most especially when you are tracking your investments where money is involved! The Archive & Settings worksheet can automatically compress your data especially reached the trade log limit. Or for the sake of maintenance you can compress it monthly. This feature will compress the “trade log” and “bank transfer” data while retaining all important reports. Your journal “cash balance” and “stock positions” should match your actual portfolio before using this feature. Just follow the instructions from the worksheet and you are good to go!
Also, if your broker charges different fee settings, then you can update the Broker’s Fee Settings.
Lastly, if you want a fresh start or if you want to use your PSE Trading Journal spreadsheet for another broker, you can use the DELETE TRADE DATA.
And To Sum Up Everything
So there you have it, the latest PSE Trading Journal spreadsheet version 8.1! There’s too much more to say but it is up to you to explore.
For me, the tool is very helpful especially when reviewing my previous trades and planning for new ones. Also, it’s not like any other products where the seller will just leave you in the air after purchasing the product. When you contact the developer is very kind and accommodating to his clients! And he provides support for any reported bugs or issues. He also accepts suggestions.
Contact the developer
Here are the options how you can contact the developer to inquire, get a trial version, or purchase the Premium version.
- AA Excel Spreadsheets on Facebook
- Or our Contact form below
Download the PSE Trading Journal Spreadsheet (Trial version). Try it for yourself and experience how it works.
If you want to get the latest TRIAL version and try how PSE Trading Journal spreadsheet works, then send us your email address below and you will get the links from the automated response. If you have any further questions or inquiries, please use the options above.
And here’s how we rated this product
-
Portability
-
Accessibility
-
Data Retention
-
Data Accuracy
-
Support
Our verdict
PSE Trading Journal Spreadsheet V8.1 is fully loaded with very informative charts, tables and information. Overall, for me, the tool is very handy and useful! This is specially when tracking your trades. You can track your historical mistakes and wins which will help you improve your future trades!
If you get the chance to use this tool, we encourage you to rate it please! Also, if you have comments about this product – positive or negative, please add it below so that it reaches the developer to fix/improve.
Ronnel Vargas
Hi,
This is to request if you could share the trial version of the trading journal spreadsheet, please?.
Thank you!
Regards,
Ronnel Vargad
Arsie Organo Jr.
Sorry, I am not the developer. You can contact him through his FB page.